

In July, we focused on improving how the app works day-to-day. We added new health components, made charts available across all sections, and introduced manual data editing for more metrics. You can now export ECG readings to PDF, sync blood pressure with Apple Health, and access new parameters like VO₂, energy expenditure, and blood glucose.
ECG Data Export to PDF
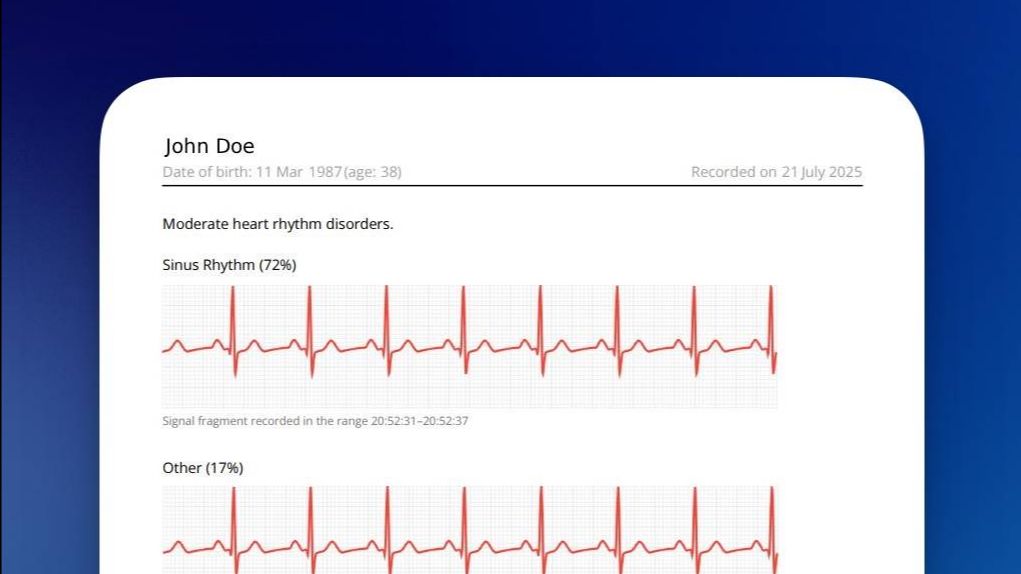
You can now save ECG readings as a PDF file — a convenient way to share results with your doctor or keep a personal archive.
Each file includes:
- the ECG trace itself,
- key parameters such as heart rate and duration,
- and metadata describing the session.
This makes your ECG analysis portable and professional.
Apple Health Integration
Blood pressure has joined the list of parameters synced with Apple Health.
Your records stay consistent across platforms, so you can easily follow long-term trends and analyze how your health evolves over time.
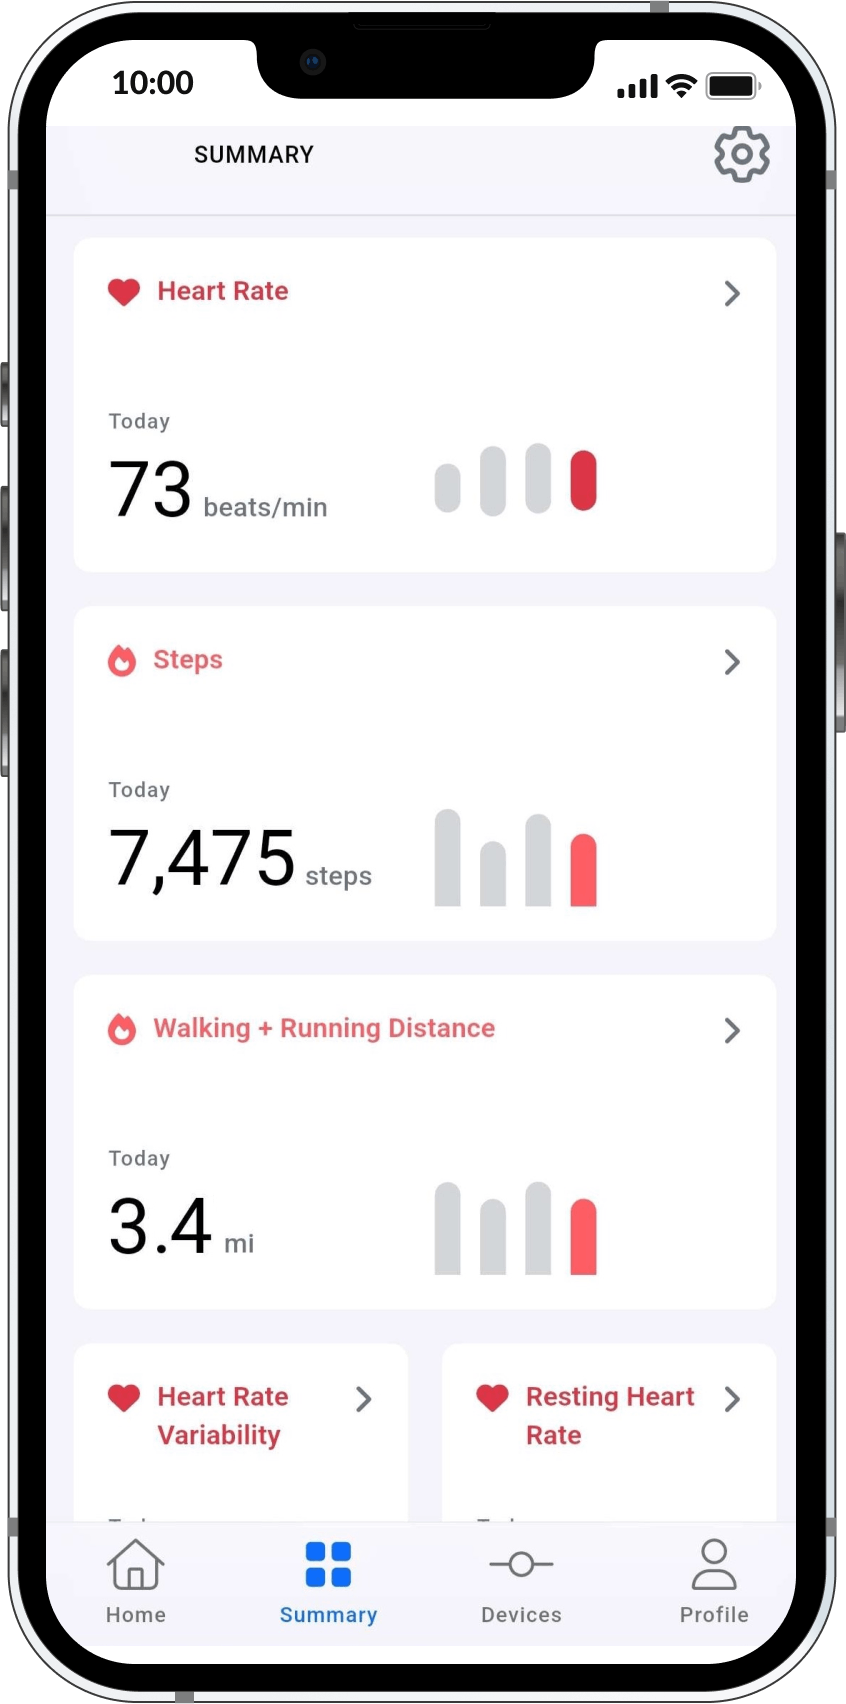
Charts in All Components
Every health component — whether in daily summaries or during workouts — now includes interactive charts.
They let you visualize how metrics like heart rate, respiration, or temperature change throughout the day or session.
Editing Health Data
You can now manually add or remove entries for:
- heart rate,
- HRV (heart rate variability),
- skin temperature,
- and respiratory rate.
This gives you full control over your data — perfect for users combining multiple sources or fine-tuning results.
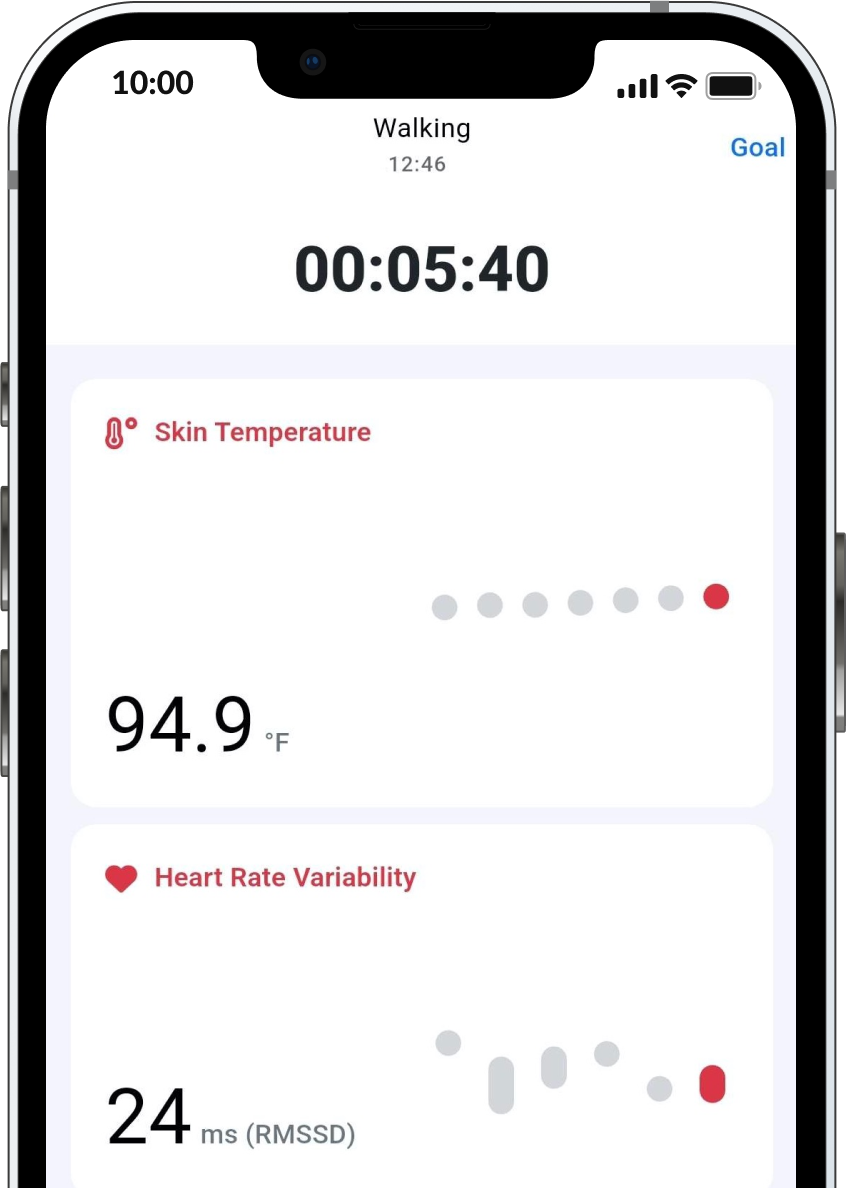
More Data During Workouts
We’ve expanded the metrics visible during workouts.
You can now monitor body temperature and HRV in real time — helping you better understand how your body responds to different effort levels.
New Health Components
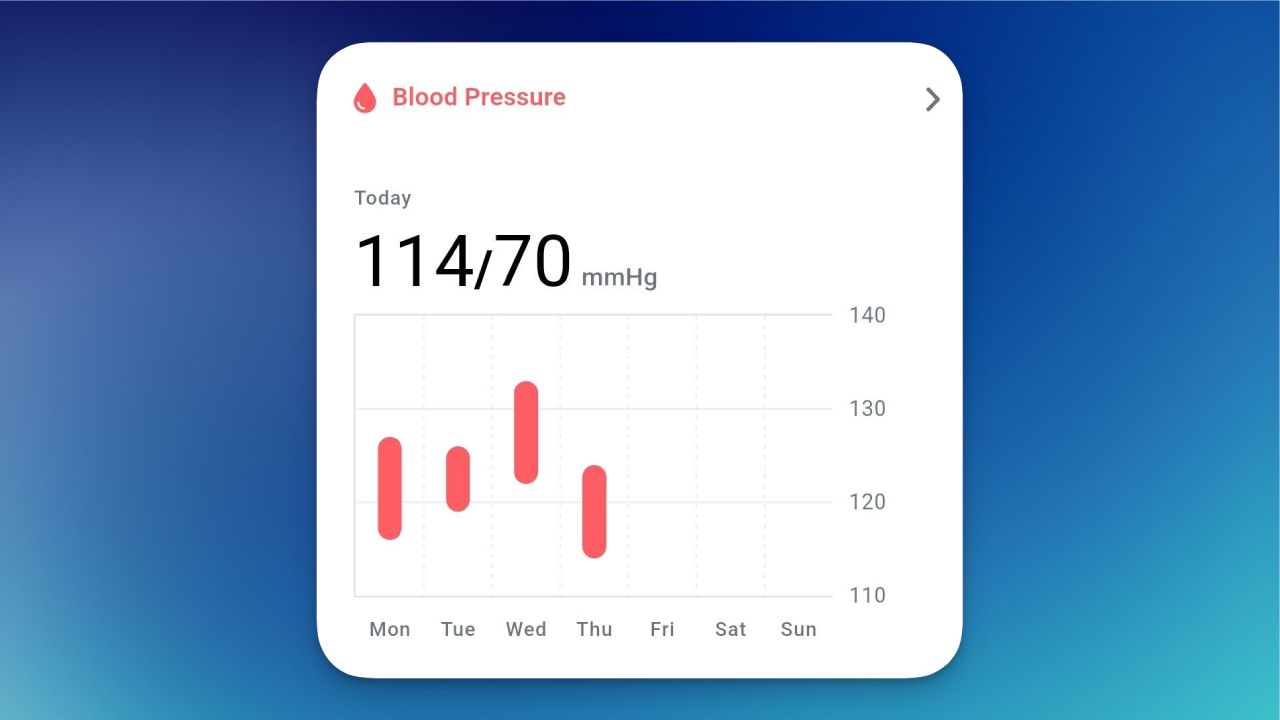
Blood Pressure
One of the key markers of how your circulatory system functions.
Regular tracking helps you notice important changes early.
Energy Expenditure
Shows how much energy you’ve used during activity.
Useful for managing calorie balance, planning recovery, and assessing workout intensity.
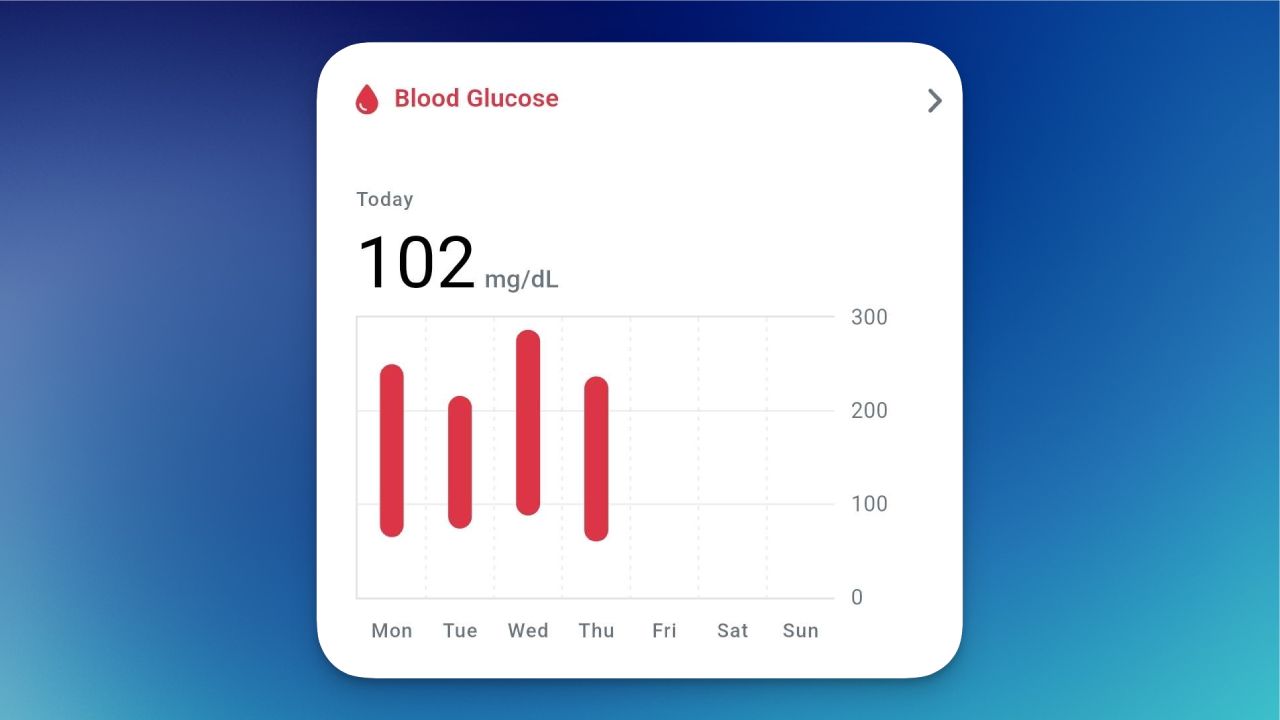
Blood Glucose
Helps you monitor blood sugar levels throughout the day.
Essential for understanding how your body reacts to meals, stress, and exercise.
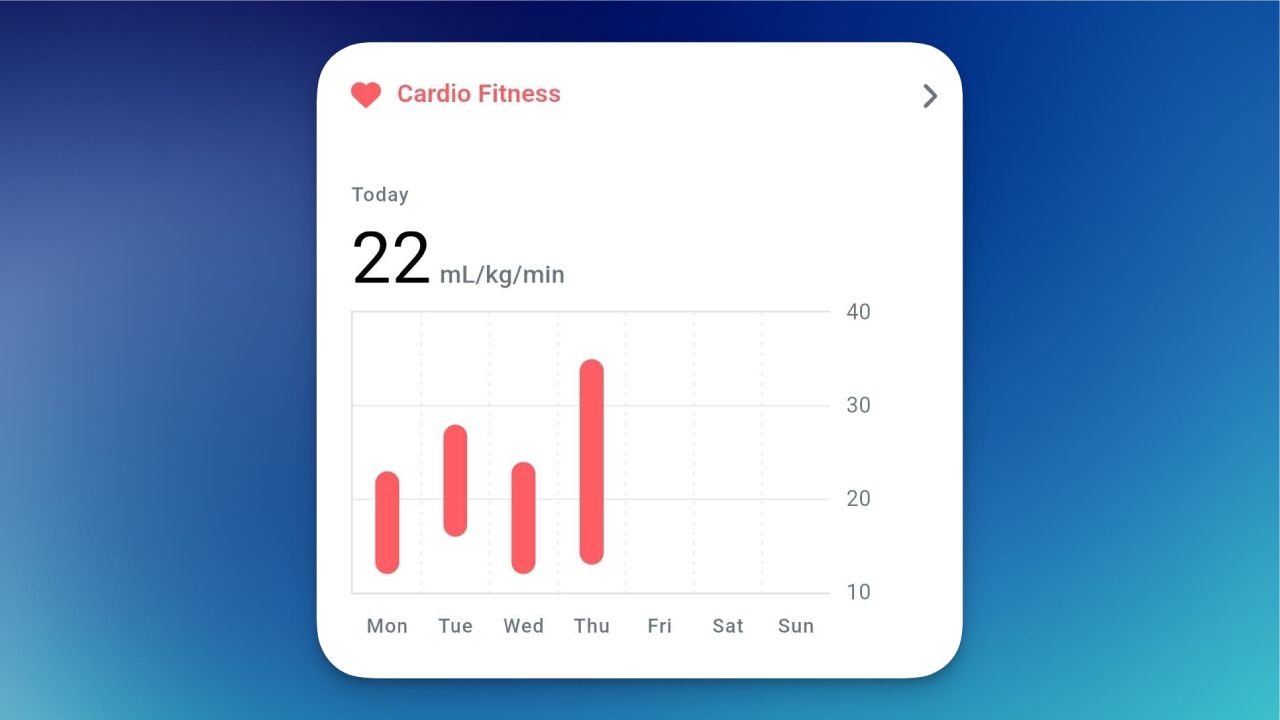
VO₂ (Oxygen Uptake)
Reflects how efficiently your body uses oxygen during activity — an important metric for endurance and overall fitness.
A Few Things That Might Come in Handy
Together, these updates make the Aidlab app more capable and more personal.
You can now:
- track more parameters,
- edit your health data freely,
- and export key results for easier sharing and research.
Each improvement brings us closer to a system that adapts to how you live and helps you understand your health at a deeper level.
Available now in the latest version of the Aidlab app.