
Stress hides in plain sight, so we dig into multi signal monitoring-heart rate, respiration volume, motion-to separate panic from posture changes. You will see why single metric apps get fooled, how white coat spikes manifest, and how physiological data can reveal what self-perception often misses.
I work closely at Aidlab with our clients to ensure their research is conducted as smoothly as possible. Currently, most of the studies we are assisting with are focused on the physiological effects of stress. For example, we’ve monitored players during gameplay to see how their physiology reacts under pressure and whether the game is truly engaging.
So, What Is Stress?
When you sense a threat, your brain doesn’t wait for you to think about it. It flips a switch inside your autonomic nervous system (ANS). The ANS runs most of the background processes that keep you alive: heart rate, digestion, blood pressure, breathing (you don't have to remember to breathe, do you?).
It has two parts: the sympathetic and the parasympathetic.
The first one works like an accelerator. It speeds up your heart, tightens your muscles, moves blood toward the limbs, inflates your lungs. The second one is the brake. It slows everything down once the danger is gone.
 A person facing a real stressor.
Stress is basically when that balance breaks. The accelerator stays pressed a bit too long.
Why Measure Stress
It wasn’t long ago when I discovered something surprising: humans can experience stress even when the mind is completely unaware of it!
A particularly interesting phenomenon is the so-called white coat syndrome. In this syndrome, approximately 1 in 5 people, who don’t suffer from hypertension, get very high blood pressure readings. However, this high blood pressure reading only occurs when these individuals are examined by the doctor. The root of this is anxiety caused by the sight of medical staff. Although some patients are aware of and become visibly nervous during a doctor’s appointment, most say that they feel ordinary.
That’s the problem.
You can’t really trust your brain to know when you’re under stress. You can only trust your physiology. And the only way to capture that is to measure it continuously, not just once in a while.
When the sympathetic system takes over, a few things happen. Respiration deepens. Heart rate variability (HRV) drops. Blood pressure rises a bit. If the body doesn’t recover, the baseline slowly drifts upward. That’s chronic stress, or what researchers call allostatic load — the accumulated cost of staying ready for too long. It doesn’t feel like panic. It feels like nothing.
You just get tired faster, sleep worse, lose focus. The system never really resets.
How To Measure Stress
Fun fact: measuring objective stress is surprisingly difficult.
You probably own a smartwatch that claim to monitor stress levels. They usually estimate stress by tracking changes in heart rhythm. But how exactly do they do that?
There’s an old but powerful concept called the Baevsky Stress Index (SI). It’s based on the distribution of RR intervals — basically the time between heartbeats. It tells you how much the sympathetic system is driving the heart.
SI is different from heart rate. It’s not about how fast the heart beats, but how rigid the pattern becomes. A healthy heart doesn’t tick like a metronome. It should vary slightly, adapting to every small input.
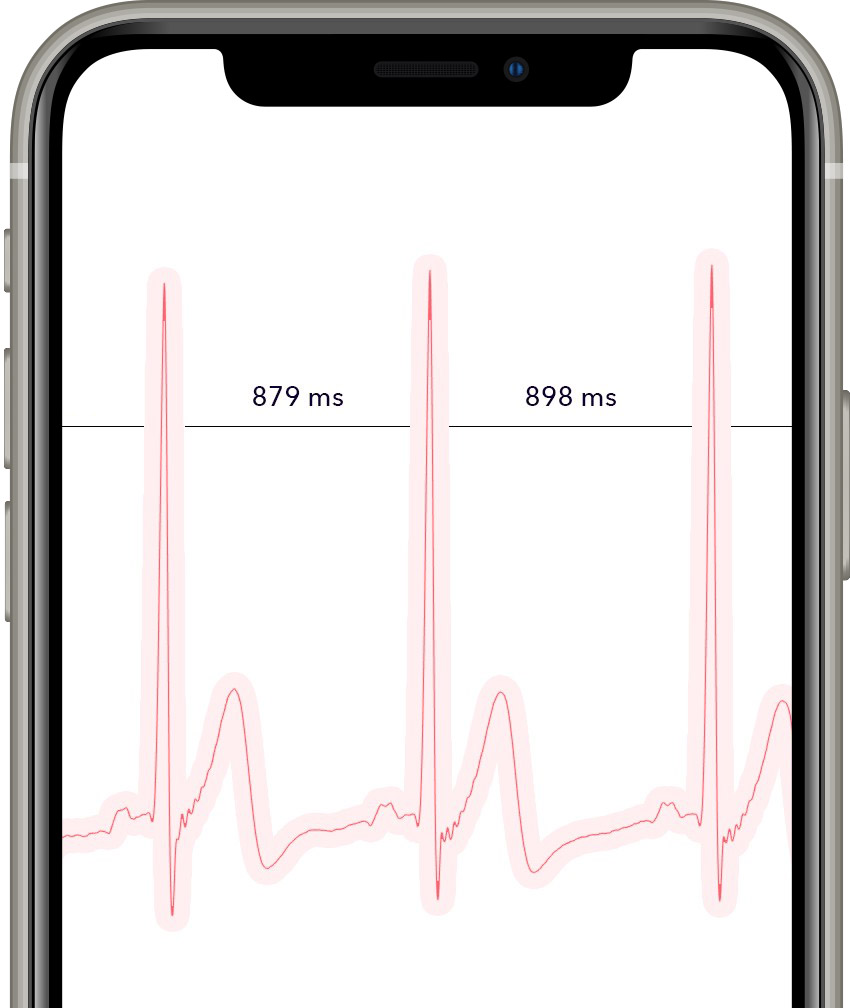 Differences between consecutive heartbeats (HRV).
When stress kicks in, that flexibility collapses. The rhythm becomes mechanical.
However, it can be argued that it’s nearly impossible to measure HRV accurately with a smartwatch. Most of them rely on optical sensors that detect blood flow through the skin, which is fine for tracking general heart rate but far too imprecise for measuring millisecond-level variations between beats. Even slight wrist movement, skin tone, or lighting can distort the readings. The second thing is that HRV alone doesn’t tell the whole story.
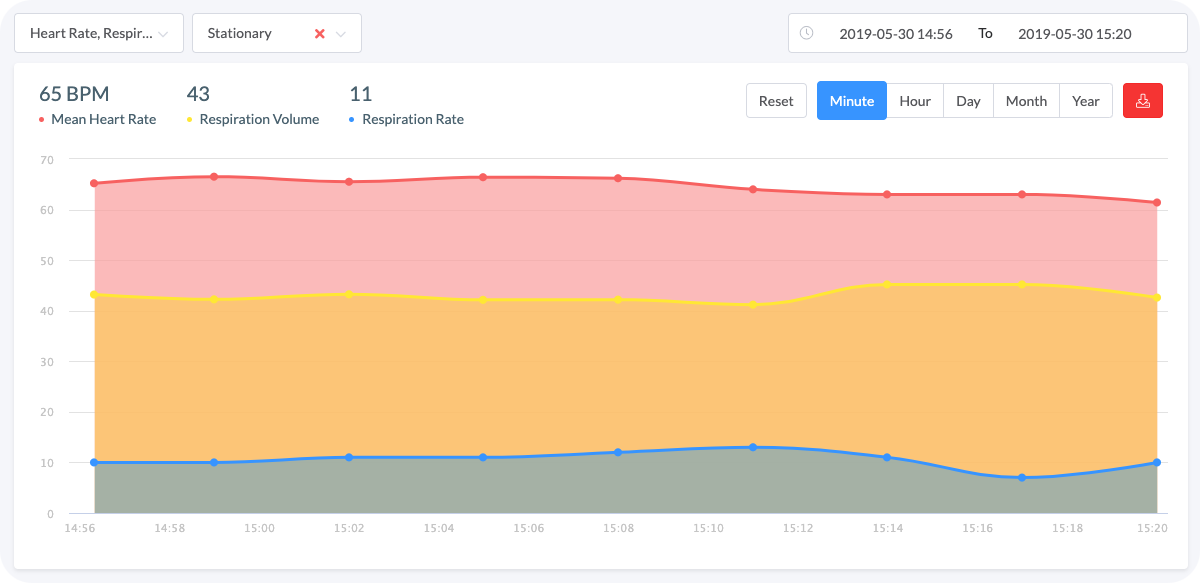
For example, this data was collected from an office worker in a stationary position:
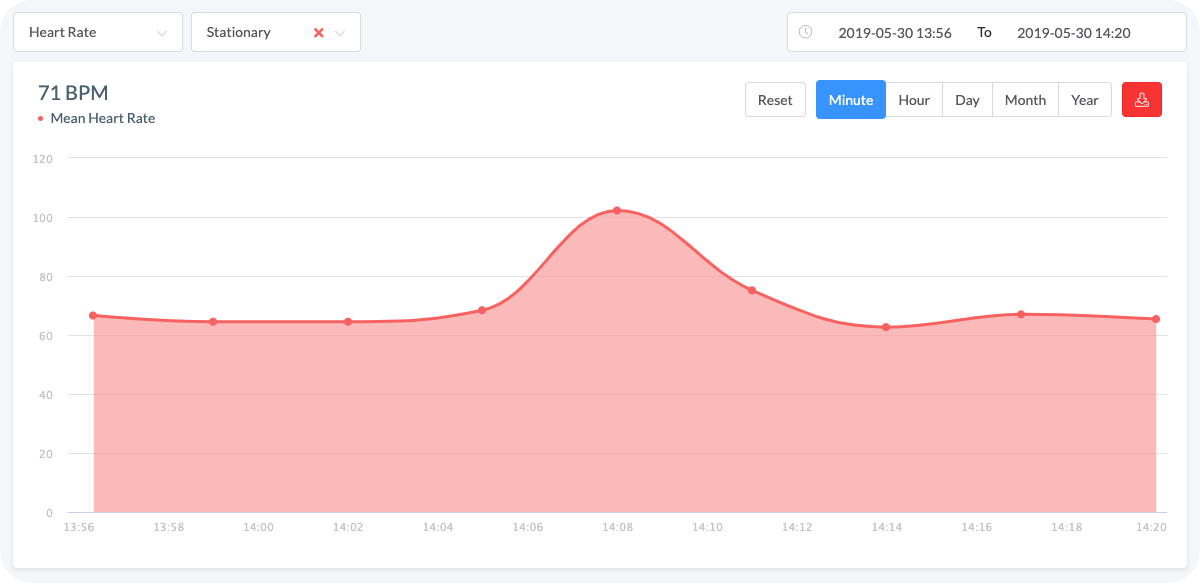 Graph 1. Heart rate peak without any context might be insufficient to determine the trigger of the stress
The rise in collected heart rate data suggests increased stress (it turned out later - that it's not).
If we want to check whether the prediction based on heart rate alone is valid, we can utilize the respiration rate (which might or might not change as stress rises) and respiration volume (which has to increase due to bigger demand for oxygen - it might occur by one taking deeper breaths, not necessarily accompanied by changing respiration rate).
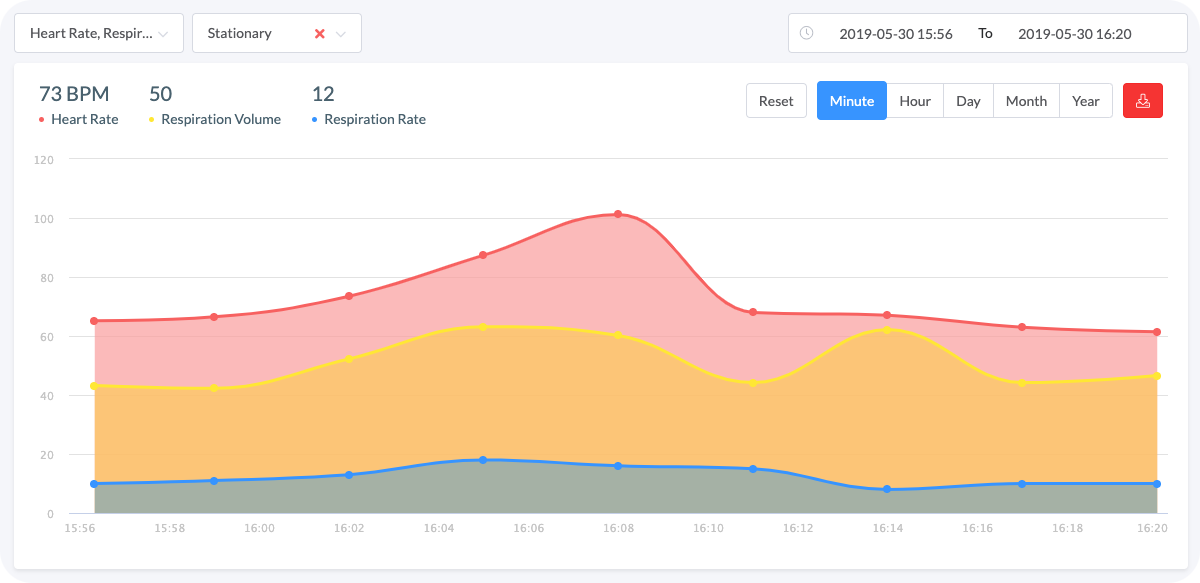
Including this data helps visualize the relationship between these events and understand their cause and impact:
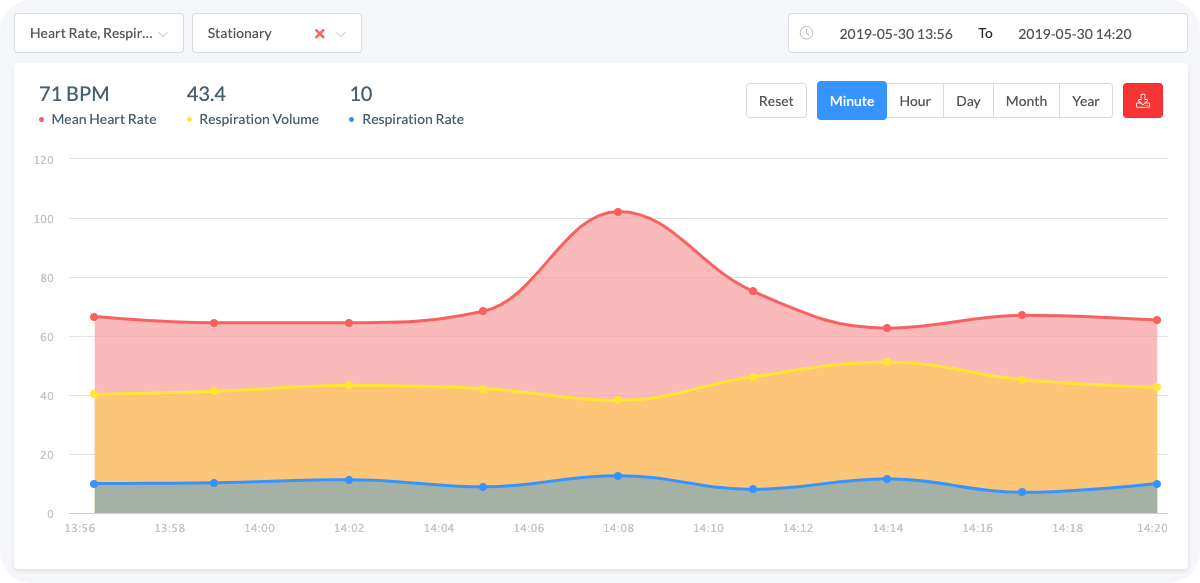 Graph 2. The more we know, the less we need to guess
Additional respiration data dramatically changed the interpretation - the stable respiration recordings allow us to conclude that the increase in heart rate was not stress-induced.
When Stress Shows Up in Data
You don’t need an arrhythmia for your heart rate to change suddenly. For instance, factors such as ambient temperature or changing body position might alter heart rate. It's also essential to have information concerning if the data was collected during motion, or after remaining stationary for a few minutes, to differentiate between mental and physical stress:
 Graph 3. The biosignals are stable because the subject is stationary and calm
The measurements highlighted in the graph above were taken when the worker was performing his daily tasks. All signals are stable which indicates that he is relaxed.
 Graph 4. The biosignals fluctuations intensify when a stress factor is introduced
The parameters in Graph 4 shot up as he was assigned a difficult, urgent task. Did you notice that the respiration rate in Graph 4 is only slightly elevated? However, the volume increased significantly meaning the subject is compensating for his oxygen demand by taking deeper breaths rather than increasing their quantity. Therefore, only having the heart and respiration rates would not clarify the nature of their changes.
Graph 3 and 4 allow us to realize how easy it is to detect stress and determine its intensity, providing that the right data is acquired.
The Last Ingredient: Electrodermal Activity
We learned the most about stress from games.
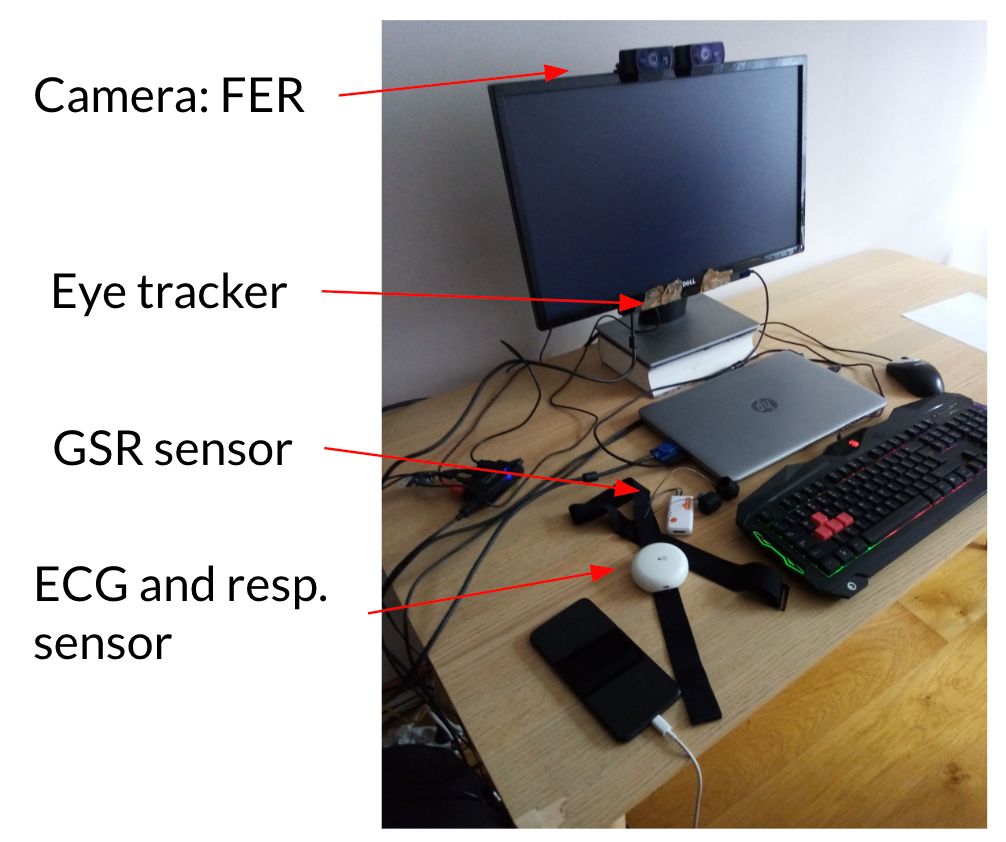
During one of our studies (Czekaj, et al., 2023), we monitored players’ biosignals while they played fast-paced games like Tetris, Tower Defense, and Space Invaders. The setup was simple: ECG, respiration, electrodermal activity, and an eye tracker as a supporting measure.
What surprised us was how early skin conductance reacted compared to other signals. In Tetris, for example, we noticed small EDA spikes seconds before the game sped up or a critical piece appeared on screen. In Tower Defense, spikes occurred right before players made quick placement decisions under time pressure. Heart rate and respiration responded later. The body knew before the player did.
Electrodermal Activity (EDA), or skin conductance, is a direct reflection of sympathetic activation. It doesn’t care about heart rhythm or breathing rate. It is pure arousal, the body’s signal that something just got important.
We had been training a classifier to recognize how engaged a player was during gameplay, using biosignals as input. The goal was simple: could we detect moments of focus, flow, or stress purely from physiology?
With ECG and respiration alone, the model’s accuracy hovered around 0.61 across different players.
Player View ~ Game View correlation
| Set of signals | Player-independent | Player-dependent |
|---|---|---|
| SIG-1: ECG + Respiration | 0.611 | 0.789 |
| SIG-2: ECG + Respiration + GSR | 0.622 | 0.879 |
| SIG-3: ECG + Respiration + GSR + Eye Tracking | 0.883 | 0.938 |
Player View ~ Self Assessment correlation
| Set of signals | Player-independent | Player-dependent |
|---|---|---|
| SIG-1: ECG + Respiration | 0.538 | 0.811 |
| SIG-2: ECG + Respiration + GSR | 0.585 | 0.881 |
| SIG-3: ECG + Respiration + GSR + Eye Tracking | 0.728 | 0.920 |
Adding EDA raised it to 0.88.
That’s when it clicked for us. Stress and engagement aren’t psychological constructs. They are physiological timelines. EDA just happens to be the first line in that timeline, the system whispering: pay attention.
Building a Modern Framework for Studying Stress
Let’s glue together everything so far. Measuring stress is messy because every system in your body reacts on a slightly different timeline. Heart rate spikes in seconds. Respiration volume changes more slowly. EDA might lag by a full minute. What we really want is not a single number but a picture of the whole process — the cascade:
- ECG, for heart rate and RR intervals (the raw material for HRV and the Baevsky Stress Index).
- Respiration, both rate and depth, since stress usually shows up there before you notice it.
- Electrodermal Activity (EDA), or skin conductance, which reflects sympathetic activation through sweat gland activity. It’s one of the clearest real-time indicators of arousal.
- Motion, to separate mental stress from physical effort.
- Context, like time of day or ambient temperature, which changes how signals behave.
Now, timing. Researchers usually start with a baseline measurement right after waking up. That’s when the body is the quietest system it will be all day — no caffeine, no muscle tension, no cognitive noise. The autonomic nervous system is at rest, so what you see is the real baseline: how much sympathetic versus parasympathetic tone exists before life starts interfering.
Here’s a simplified flow of how raw biosignals become interpretable stress metrics:
And on a higher level, the analytical layer turns structured physiological data into interpretable research outcomes:
This kind of framework is what makes stress research today more reproducible and scalable.
How Reliable Can Measuring Stress Get?
Even with all this structure, stress research is still a bit of a wild west. The hardest part isn’t collecting data, it’s trusting it. Every signal you record lives in a noisy, biological reality. Electrodes drift, respiration belts slip, skin conductance spikes because someone scratches their nose. After a while, you realize that half your work isn’t analysis at all, it’s cleaning up what you thought was real.
That’s what keeps most researchers awake at night: not the absence of data, but the uncertainty of what it really means. Two datasets can look identical and tell completely different stories depending on context. Was that heart rate spike stress or caffeine? Was the EDA burst anticipation or a warm room? You can’t know unless you capture the full picture, with synchronized physiological channels and proper context tagging.
Several studies have already tried to assess how far we can push consumer wearables when it comes to stress.
For example, Flett et al. (2024) tested Garmin smartwatches under controlled stressors and found that while they could detect some physiological change, the signal strength and consistency dropped dramatically depending on the type of stressor. Similarly, Li et al. (2023) proposed a systematic way to evaluate HRV accuracy against ECG references, showing how even minor noise sources can distort HRV-derived stress scores.
In a larger validation pipeline, Darwish et al. (2025) demonstrated that as measurements move from the lab to real life, accuracy steadily declines (which kind of says it all). More recent consumer studies tell the same story. The Apple Watch Series 9 underestimates HRV by about 8 ms on average, with a mean absolute percentage error of nearly 29 %, while Samsung smartwatches perform well only during sleep, when the body (and the wrist) stay still.
And even when models perform well in the lab, Amin et al. (2025) showed they often break when transferred across different devices — the hardware really matters.
Consumer wearables try to make this simpler, but they cut corners that researchers can’t afford. The irony is that these watches proudly show a daily “stress score,” yet when you compare it to real ECG data, the correlation often disappears.
Feeling stressed?
Aidlab 2 is a wearable that can help you calm down thanks to its accurate HRV, EDA and respiration sensor. Take advantage of our user-friendly breathing exercises, visually guiding you every step of the way to reach inner peace.
That’s why the field is moving toward multimodal sensing. Instead of trusting one imperfect signal, you combine several: ECG, respiration, EDA, motion. When all of them shift together, you know you’re getting closer to the truth. But that’s only the first step.
The real value appears when you stop looking at short windows and start following long-term trends. Like, how stress patterns evolve over days, weeks, or entire therapy cycles. You begin to see whether interventions actually help, whether recovery gets faster, whether you feel better not just today but in the long run.