
Heart Rate Variability (HRV) has long captured the curiosity of scientists, biohackers, and users of health-tracking wearables. It’s a subtle yet remarkably rich indicator that reveals how our nervous system responds to stress, recovery, and emotions. But behind its growing popularity lie hidden pitfalls: inaccurate measurements, signal noise, and differences between measurement technologies. In this article, we show how to approach HRV with scientific precision.
Let’s start with something simple.
HRV is the variability of intervals between consecutive heartbeats.
Sounds simple, right?
But this tiny difference in timing between beats can reveal a surprising amount about how your nervous system works. In recent years, HRV has caught the attention of scientists, athletes, and anyone curious about how their body really operates.
Before we answer how to measure HRV (and how to interpret the results), let’s explore why we measure it.
Why measure HRV?
HRV shows how your body responds to the world — stress, sleep, emotions, temperature, and even what you had for dinner.
It doesn’t measure the strength of your heart but its flexibility. How well it can slow down or speed up when the situation demands it. It’s simply a signal that your autonomic nervous system is trying to tell you something.
The rule of thumb:
⬆️ High HRV usually means balance and readiness.
⬇️ Low HRV may indicate overload, stress, or poor recovery.
At first, this may seem counterintuitive — but that’s just how it is. So remember: the greater the variability, the better.
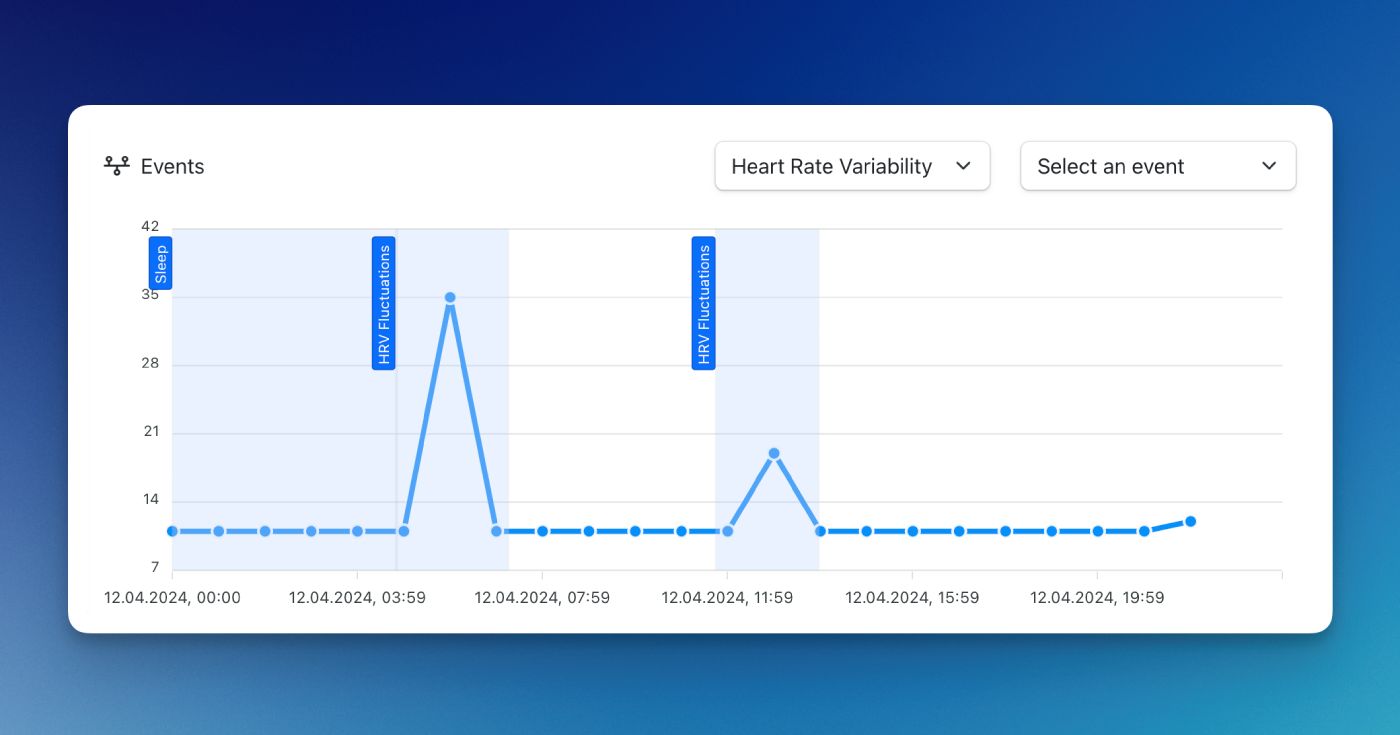
Here’s a fun fact: in nighttime HRV measurements, there’s often a characteristic “quiet window” between 2:00 and 4:00 a.m. That’s when the parasympathetic system — the one responsible for calm and recovery — takes over.
In people with chronic stress or sleep problems, that window can disappear. Their nervous system doesn’t let go, even at night.
So what does your HRV score actually mean? What’s considered high or low? And does today’s score matter more than yesterday’s?
Measuring HRV
Smartwatches, rings, and fitness bands — everyone measures HRV. The problem is, not every measurement makes sense.
Different devices use different methods: some analyze the electrical signal of the heart (ECG), while others use light to detect changes in blood flow (PPG). On top of that, there are differences in sampling frequency, filtering algorithms, calculation methods, and measurement duration.
As a result, two devices can show completely different results — even when you wear them at the same time.
That’s why before asking “what’s my HRV?”, it’s better to ask “how was it measured?” Only then does the number begin to mean something.
Understanding HRV
HRV isn’t an absolute value. It’s a contextual indicator that gains meaning only when you observe it over time.
Apple, for example, uses the SDNN metric — the standard deviation of intervals between heartbeats within a selected time window. SDNN describes overall variability but strongly depends on the length of the measurement. Shorter measurement = lower SDNN.
| HRV Level (SDNN, ms) | Physiological meaning | Possible interpretation |
|---|---|---|
| < 20 ms | Very low variability | High stress, poor recovery, strong sympathetic dominance |
| 20–50 ms | Low variability | Fatigue, insufficient sleep, emotional tension |
| 50–100 ms | Medium variability | Stable condition, moderate stress, general balance |
| 100–200 ms | High variability | Good physical condition, healthy autonomic balance |
| > 200 ms | Very high variability | Strong parasympathetic dominance, often seen in athletes or deep relaxation |
Values refer to short (5-minute) resting measurements. For 24-hour recordings, SDNN values are usually higher — typically 100–180 ms in healthy adults.
Aidlab, Garmin, Polar, and WHOOP more often use rMSSD, the root mean square of successive differences between R-R intervals (explained below). rMSSD responds faster to changes in vagal activity, so it better reflects the influence of recovery and stress.
| HRV Level (rMSSD, ms) | Physiological meaning | Possible interpretation |
|---|---|---|
| < 20 ms | Very low variability | Chronic stress, fatigue, poor recovery |
| 20–40 ms | Low variability | Tiredness, lack of sleep, overtraining |
| 40–80 ms | Medium variability | Stable state, moderate stress, good condition |
| 80–120 ms | High variability | Good recovery, balanced nervous system |
| > 120 ms | Very high variability | High adaptability, often seen in athletes or people with high physiological reserves |
Approximate values for resting measurements in adults.
SDNN and rMSSD are simply two different ways of looking at the same phenomenon. SDNN represents long-term autonomic balance, while rMSSD shows short-term heart flexibility.
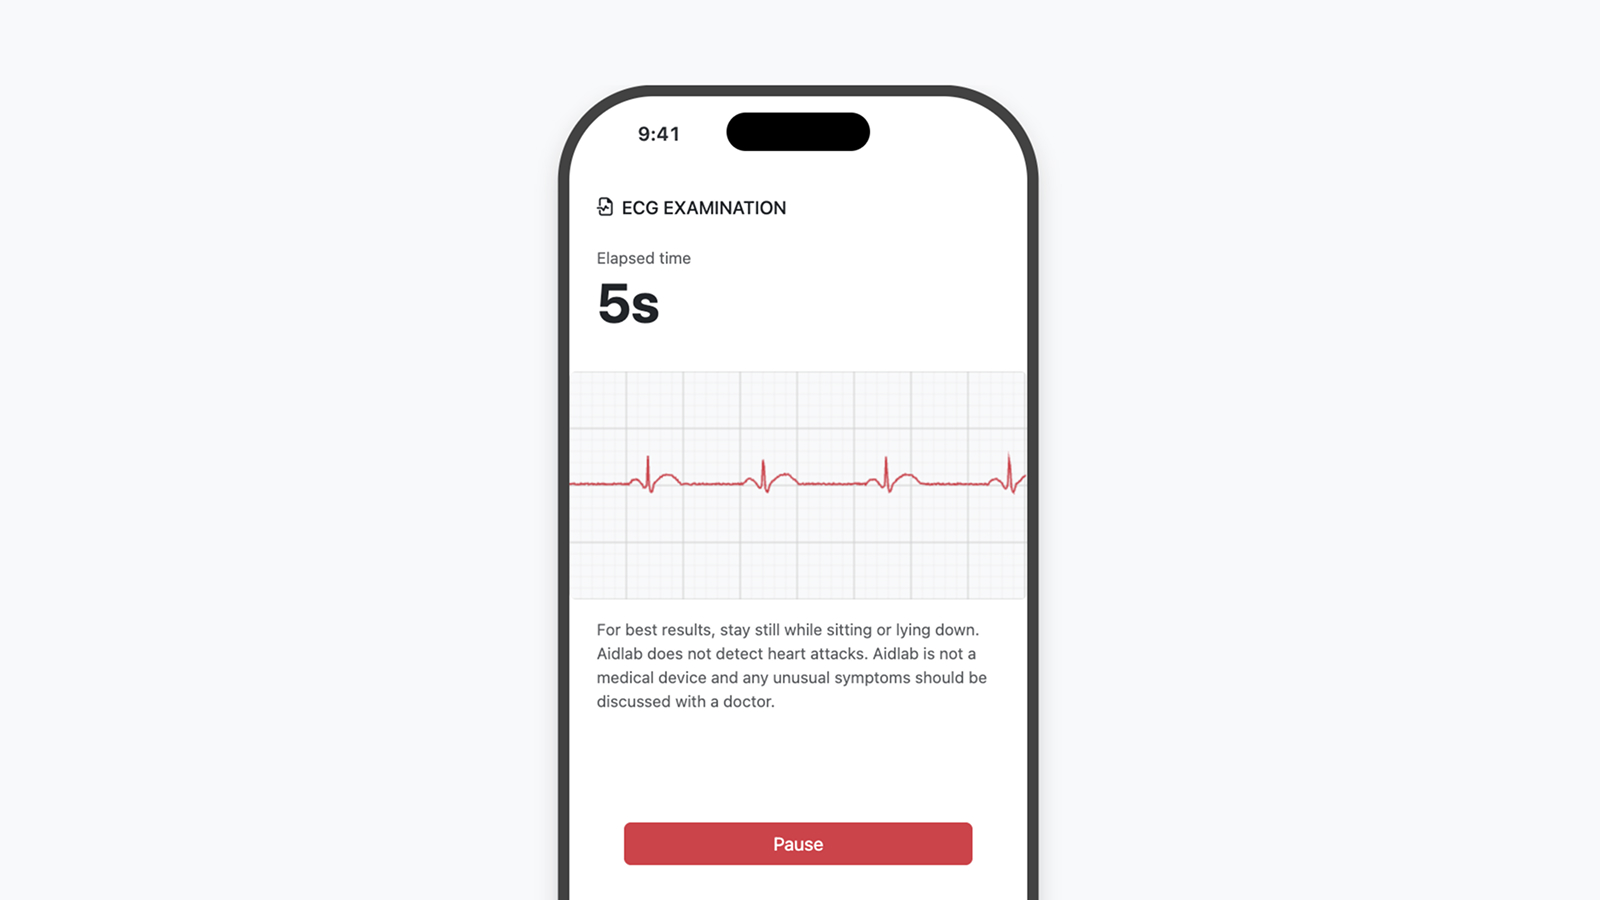
Measuring HRV with ECG
The most accurate way to measure HRV?
The electrocardiogram (ECG).
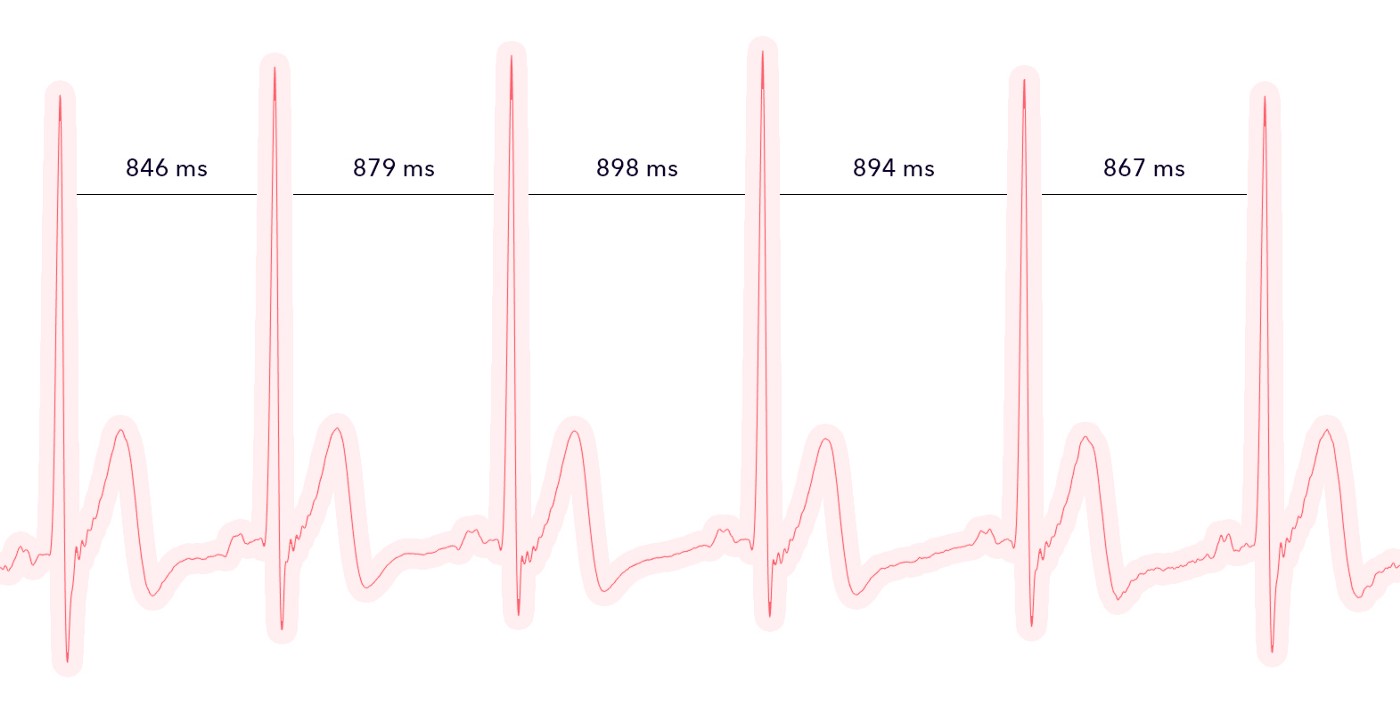 ECG with annotated R-R intervals — the time differences between heartbeats.
An ECG records the electrical activity of your heart. Each distinct spike you see on the graph is a beat — the exact moment the heart says pump.
ECG offers a level of precision that’s hard to beat. But it’s not perfect. Body movements distort the signal. Electrodes can come loose. Sweat, friction, and motion — all interfere. And let’s be honest, no one likes having sticky electrodes on their chest for half the day.
PPG: easier, but with a catch
The second method is photoplethysmography (yes, a mouthful). In short, it’s an optical measurement taken from the surface of your skin.
Instead of tracking electrical impulses, PPG detects changes in blood volume. LED light shines, blood absorbs part of it, and a sensor records the variations. Each pulse corresponds to an increase in blood flow — a new measurement point.
The downside? It’s less accurate than ECG. Motion, light, and skin tension all affect the signal. With ECG, you measure the heart directly. With PPG, you measure its echo — the effect visible at the skin’s surface.
When should you measure HRV?
HRV reacts to everything: stress, emotions, temperature, caffeine, lack of sleep.
That’s why consistency matters more than intensity. Measure it daily, at the same time, in calm conditions. No talking, no coffee, no notifications. Five minutes of stillness tell you more than an hour of scattered data.
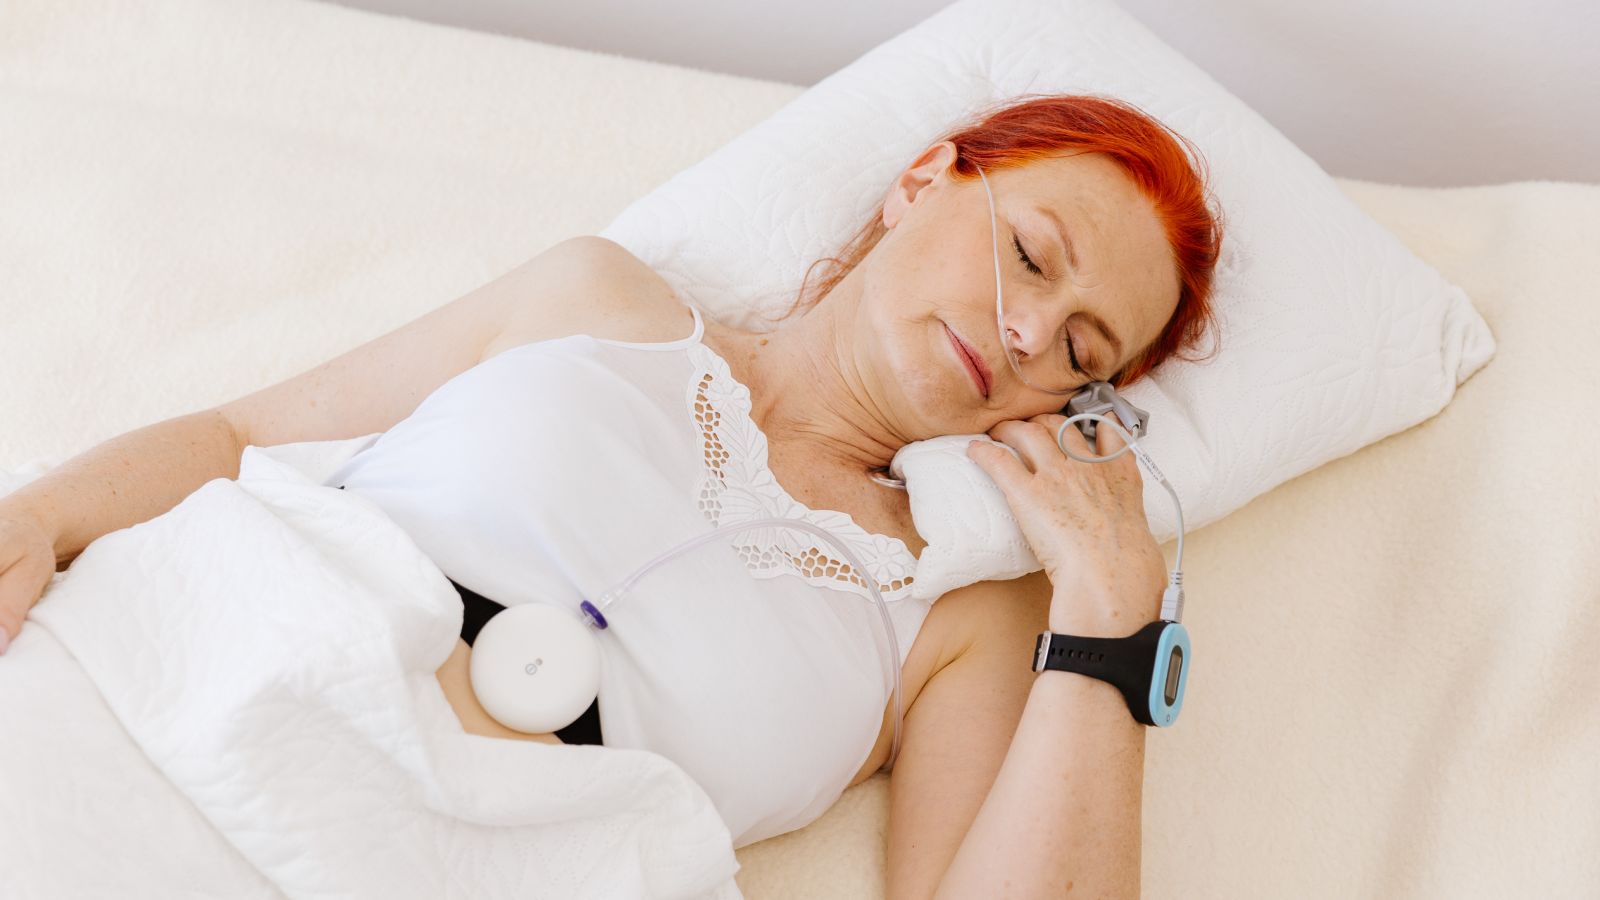
And if you have data from the entire night — even better. You’ll start to see trends and patterns, a kind of map of your nervous system.
Simple rules:
- Measure at the same time each day, ideally in the morning before getting out of bed.
- Avoid conversations.
- Skip caffeine until after.
The gold standard in HRV measurement
Aidlab 2 records ECG signals without cables or gels, offering HRV accuracy comparable to clinical systems.
Learn moreHRV isn’t a signal from a single system. It’s a complex dialogue between the heart and the brain. A rhythm that emerges somewhere in between — in tiny fluctuations that reflect everything: stress, emotions, sleep, adaptation.
There is no “good” HRV. There is only HRV that tells you something about yourself.
So instead of chasing numbers, learn to read them. Because within those small differences between heartbeats, you can truly see how you live.